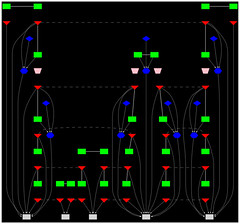
Graphviz是一個使用指令方式來作畫的繪圖工具。
它的特點
使用指令作畫,等於是用文字方式留存下來,容易實行版本控制與對比,非常有利於多人協作。
它的圖形引擎會讓每個節點之間的關聯線以最少重疊的情況自動布局,免去每次調整圖形布局的繁雜工作。
實作範例步驟
在任何文字編輯器上敲出指令如下
This file contains bidirectional Unicode text that may be interpreted or compiled differently than what appears below. To review, open the file in an editor that reveals hidden Unicode characters.
Learn more about bidirectional Unicode characters
digraph this_diagram_name
{
rankdir=TD //TD就是top-down,圖形就是從上往下畫,也可改成”LR”就變成由左畫到右
node [shape=folder, style=filled, fillcolor=orange, fontname=微軟正黑體, fontsize=10.5, fontcolor=black, height=0.25, width=1, penwidth=0 ];
edge [arrowhead=normal,arrowsize=0.5,len=0.5, color=green];
start->FuntionList [dir=both penwidth=2 color=red];
CusAccTest->MyRelTest [dir=both penwidth=2];
MyRelTest->MySysTest->MyIntTest;
subgraph cluster_9
{
label=Requirements;
color=lightcyan;
style=filled;
start [ label=" 客戶需求" shape=oval];
CusAccTest [ label=" 客戶的驗收測試\n(測項)"];
start->CusAccTest[style = dotted];
}
subgraph cluster_0
{
label=Deliverables;
color=lightcyan;
style=filled;
FuntionList [label=" Git上的FuntionList.xlsx"];
MyRelTest [label=" 交付Test\n(rls_code_test_report_v1.8.xlsx)"];
FuntionList->MyRelTest [style = dotted];
}
subgraph cluster_1
{
label=BlackBox;
color=lightcyan;
style=filled;
MySysTest [label=" 內部系統級Test" shape=oval];
MySysTest->" test SOP"[style = dotted];
DailyBuildTest [label=" DailyBuildTest測項"];
MySysTest->DailyBuildTest[style = dotted label=" the real file"];
}
subgraph cluster_2
{
label=WhiteBox;
color=lightcyan;
style=filled;
MyIntTest [label=" 整合測試\n(點擊前往)" URL="http://www.google.com.tw"];
MyUnitTest [label=" Unit Test" shape=oval];
MyUnitSwTest [label=" 軟體模組測項\n(點擊前往)" URL="http://www.google.com.tw"];
MyUnitDriverTest [label=" Driver測項\n(點擊前往)" URL="http://www.google.com.tw"];
MyIntTest->MyUnitTest;
MyUnitTest->MyUnitSwTest;
MyUnitTest->MyUnitDriverTest;
}
}
打開下列的任一種Graphviz工具,將前一步驟的指令貼上去,執行畫圖(官方應用程式裡的動作叫做”Layout”)
各種工具:
以應用程式方式作畫:到它的官網http://graphviz.org/ 的下載區去下載並安裝使用,因為功能比較完整,我推薦這個
使用線上工具直接轉換:http://www.webgraphviz.com/ ,(但這個工具只能做簡易的圖形,太複雜的指令它處理起來會有問題)
在wiki page上直接內嵌:只要在指令的前後加上下方所示的兩個小標籤片段即可
This file contains bidirectional Unicode text that may be interpreted or compiled differently than what appears below. To review, open the file in an editor that reveals hidden Unicode characters.
Learn more about bidirectional Unicode characters
<graphviz renderer="dot" format='png' caption="YourName">
...畫圖指令...
</graphviz>
將檔案另存成jpg檔,上傳到網頁,就得到下面這張圖啦
因為圖形屬性可以更動的地方太多,請參考官網說明(http://www.graphviz.org/doc/dotguide.pdf)來自行嘗試修改
沒有留言:
張貼留言